Lorem ipsum dolor sit amet, consectetur adipiscing elit.
Make your website more effective by tracking exactly the experience your users have on your website – this tool is invaluable for adjusting client websites based on the actual user experience. It’s a lot more detailed and useful than the data from Google Analytics as its visual, instead of having to look through pages of data.
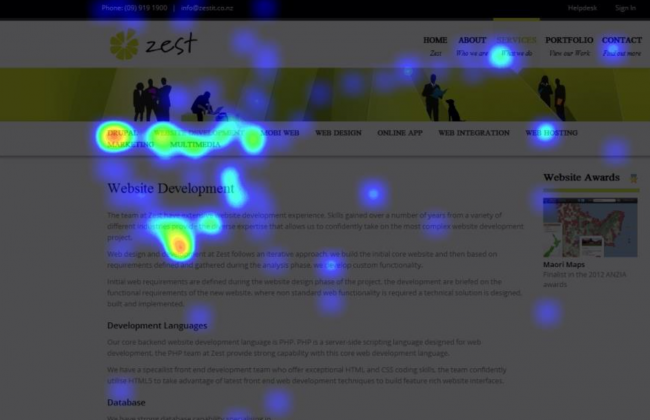
Instantly see where visitors click the most. Aggregate thousands of visitors' clicks, across different browsers and resolutions, to a single page on your site. Figure out if people are clicking on your important call-to-actions, or perhaps they are clicking on things that aren't even clickable but are of interest to them.
Learn how people read your website. People tend to read with their mouse. The movement heat maps aggregate all these mouse gestures to show you how people truly read your pages. Visualizing visitors’ mouse movements with heat maps can reveal the most important areas of your pages, allowing you to see exactly where your top content needs to go to have the greatest impact on your site’s visitors.
Ensure your most important elements are visible. Scroll Depth heat maps analyze every scroll of every visitor to your site and show you, on average, how far down people scrolled. Find the “effective fold” and see how many people reach each section of your page.
We can automatically capture every visitor that visits your website and create a "recording" of what they did. You can watch every click, scroll, move and more to find out how visitors are truly using your
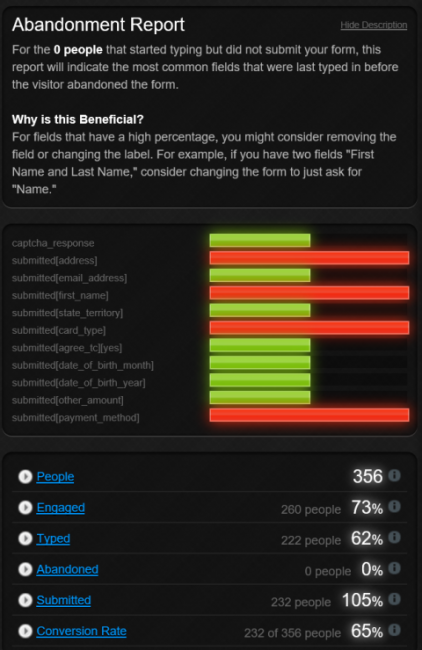
In addition to heatmaps, there are also reports that enable you to better analyse what is happening on specific forms on your website.
We offer this as a monthly subscription based service – pricing depends on the complexity of your website.